Alaska: The Return on Investment to Increasing Postsecondary Credential Attainment
Visit the Alaska Return on Investment dashboard tool >>
(NOTE: Dashboard takes a few seconds to load)
|
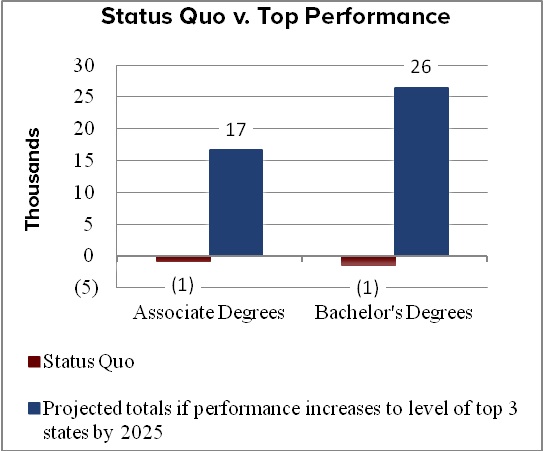
Alaska Must Improve College Participation and Credential Attainment Rates to Remain Competitive |
|
|
|
|
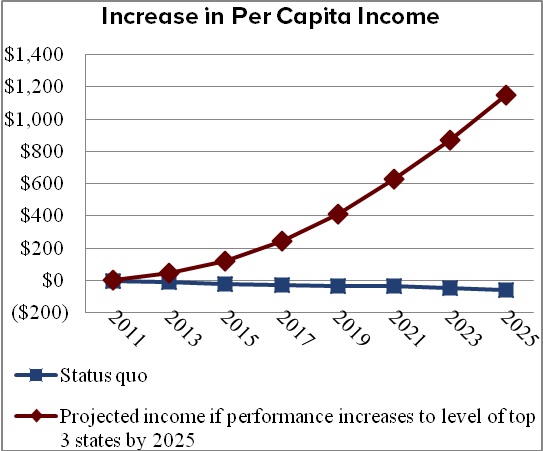
Meeting Top Performers Produces Significant Personal Economic Return |
|
|
Per capita income increases when the state meets top performers
|
|
|
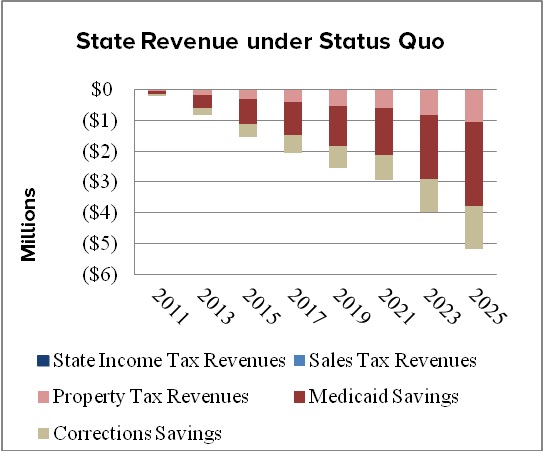
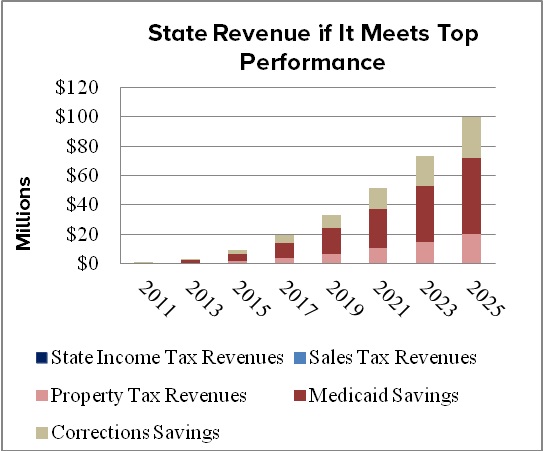
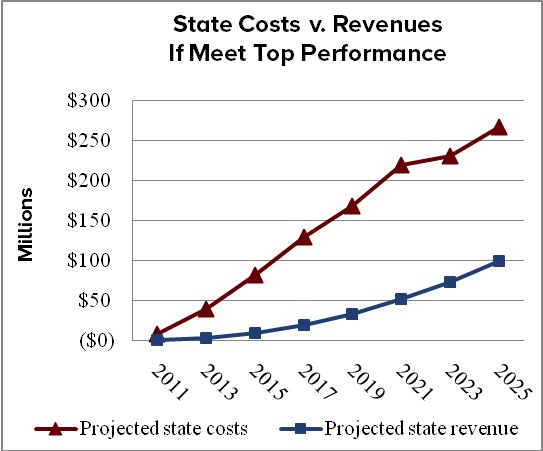
Meeting Top Performance Produces Significant Economic Returns to the State |
|
|
Status quo produces negative returns Under current postsecondary investment patterns, Alaska’s
|
Meeting top performance pays off By meeting top performance, Alaska will generate more annual revenue – approximately $100 million in 2025.
|
|
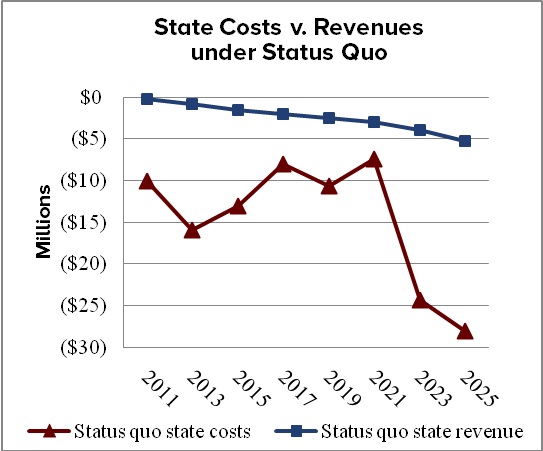
State Revenues Exceed Costs When Top Performance Goal is Met |
|
|
Status Quo: Costs and revenues Under current postsecondary investment patterns, Alaska’s postsecondary costs decline to about -$28 million in 2025, but
|
Meet top performance: Revenues increase, so do costs. By meeting top performance, revenues increase, but so do costs. Costs outpace revenues due to the state’s lack of both income and sales taxes.
|
|
This analysis was prepared using the CLASP-NCHEMS Return on Investment Dashboard tool. See clasp2022.tealmedia.dev/ROIdashboard |
|